Tables are an interesting source of data for information extraction. Unlike natural language, where a large variety of forms exist to express a certain statement, tables can have a structure that makes information extraction easier, for example, when a row contains information about one entity and each column represents a relation or attribute and this pattern is repeated for every row.
Extracting Information from Tables to Populate Knowledge Bases
When humans try to understand the meaning of a table, they make use of their background knowledge and try to identify in the table the entities, relations between entities, and attributes of entities that they know.
Consider the table below.
| Metropolitan Museum of Art | New York | New York |
| National Museum of Wildlife Art | Jackson Hole | Wyoming |
| Cincinnati Art Museum | Cincinnati | Ohio |
Let’s assume we have the following background knowledge (limited for the sake of the example). We know i) there are the categories museum, city, and state; ii) Metropolitan Museum of Art is a museum; iii) a museum is located in a city; iv) a city is located in a state; v) there is a city with the name New York and a city with the name Jackson Hole; vi) there is a state with the name New York and a state with the name Wyoming; and vii) the city New York is located in the state New York and the City Jackson Hole is located in the state Wyoming. Given the table and this background knowledge, we can try to understand the structure of the table, e. g., in each row in the first column we have the name of a museum, in the second column we have the name of the city the museum (that is mentioned in the first column) is located in, and in the third column we have the name of the state the city (that is mentioned in the second column) is located in.
Once we have understood the pattern given the knowledge that we already have, we can extend our knowledge by applying that pattern to each row. For the example above, we might learn that i) there is an entity with the name “Cincinnati Art Museum”, ii) that this entity is a museum, iii) that Cincinnati is a city, iv) the museum is located in Cincinnati, v) Ohio is a state, and vi) that Cincinnati is located in Ohio. Thus, we can extend our knowledge graph with 6 facts. For real tables, one would try to derive a pattern from multiple rows. Note that if a table does not contain entities that are contained in the background knowledge or none of the relations expressed in the table are contained in the background knowledge, then the table cannot be understood.
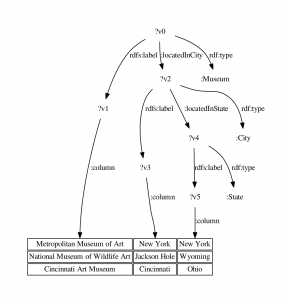
Basil Ell and his colleagues are developing an approach for automated table understanding that we sketch here. Given a knowledge graph as background knowledge and a table, we create a hypothesis graph for each row as follows: for each cell, each entity that the value in the cell might refer to is added to the (initially empty) hypothesis graph. For each two entities mentioned in a row we add all relations between those entities that we are aware of according to our knowledge graph to the hypothesis graph. Given the set of hypothesis graphs we created for a table, we perform frequent subgraph mining to identify the commonalities of the hypothesis graphs. The result for our table might be the RDF graph pattern that is shown in the following Figure where the meaning of columns is described. For example, it expressed that for each row there is a thing that is a museum and that has a name that appears in the first column.
When applying the pattern to a row, we can remove hypotheses that do not follow the pattern. For the example above, “New York” might refer to the city or the state. If we find that the other entities in the column refer to cities, we can remove the hypothesis that links to the state. Thus, the pattern helps in disambiguating entities.
Once we obtained an understanding of a table, beyond the use case of knowledge base population, further use cases can be to automatically generate mappings between data sources in an ontology-based data access (OBDA) scenario, or tables can be indexed by the relations they express so that table retrieval can be improved.
Experiments will be done with a large corpus of tables extracted from the Web: the WDC Web Table Corpus 2015 (http://webdatacommons.org/webtables/). This contains 233 million tables, among them 90,266,223 relational tables. As background knowledge, we will use DBpedia (400 million facts) and Wikidata (54 million facts). Given the large number of facts, the large number of tables and given that frequent subgraph mining is a computationally hard problem, a high-performance computing infrastructure is needed. Both the table corpus as well as the knowledge graphs are publicly available. However, the results of these experiments may motivate to apply the approach on tables that are not publicly available with a combination of public knowledge graphs as well as proprietary knowledge graphs.


